Temperature Monitoring Station:
ROSWELL/INDUSTRIAL AIR CENTER, NM
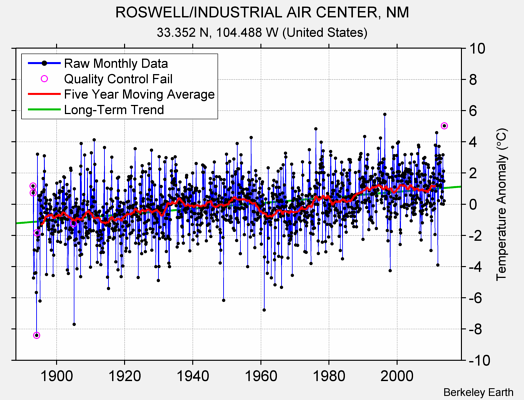
Monthly Mean Temperature Data
Raw Data relative to Expected Monthly Means
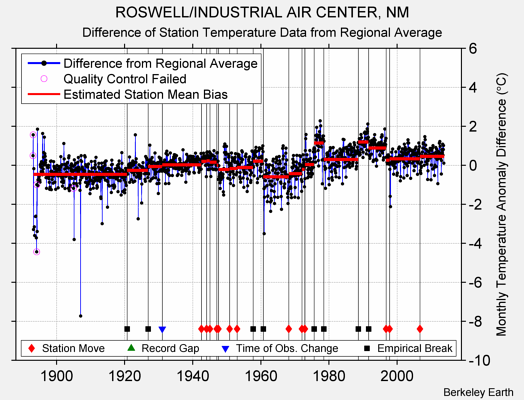
Difference from Regional Expectation
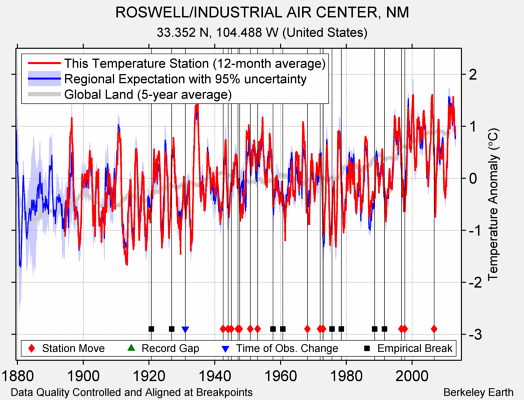
Breakpoint Adjusted Annual Average Comparison
Mean Rate of Change ( °C / Century )
| Raw monthly anomalies | 1.80 | |
| After quality control | 1.77 | |
| After breakpoint alignment | 0.82 | |
| Regional expectation during same months | 0.76 ± 0.14 | |
| National average during same months | 0.92 ± 0.09 | |
| Global land average during same months | 1.06 ± 0.04 |
Regional Consistency
Comparison of monthly mean station data to regional expectation
| Typical Difference (°C, 95% range) |
Correlation (R value) |
|
| Raw Monthly Anomalies | ± 1.5 | 0.90 |
| After Quality Control | ± 1.5 | 0.90 |
| After Breakpoint Adjustment | ± 1.2 | 0.93 |
Quality Control Summary
| Months missing 10 or more days | 4 |
| Serially repeated daily or monthly values | 4 |
| Extreme local outliers | 0 |
| Regional climatology outliers | 1 |
| Abrupt jumps | 0 |
| Marked as bad or manually changed by source | 0 |
| Exceeds global climatological range | 0 |
| Isolated observations | 2 |
| Frame shift repetitions | 0 |
| TMAX / TMIN inconsistency | 0 |
| TAVG outside TMAX / TMIN range | 0 |
| Total Observations Rejected by Quality Control | 6 |
Station ID Codes
| COOP | 297609 |
| COOP | 297610 |
| FAA | RNM |
| FAA | ROW |
| GHCND | USW00023009 |
| GHCND | USW00023043 |
| GHCNM | 42500297610 |
| GHCNM | 42572268000 |
| GSOD | 722680-23009 |
| GSOD | 999999-23009 |
| GSOD | 999999-23043 |
| HADCRU | 722680 |
| ICAO | KRNM |
| ICAO | KROW |
| ICAO | RNM |
| NCDC | 20020385 |
| NCDC | 20020402 |
| NWS | RNM |
| NWS | ROW |
| USAF | 722680 |
| WBAN | 23009 |
| WBAN | 23043 |
| WMO | 72268 |
| WWR | 72268 |
ID codes may be repeated if the identification of the station changed during its history or if two different records were found to contain the same data, in which case the records would be merged.
| Country: | United States |
| Monthly Observations: | 1440 |
| Latitude: | 33.3517 ± 0.0567 N |
| Longitude: | 104.4883 ± 0.0467 W |
| Elevation: | 1,108.10 ± 10.25 m |
| Earliest Observation: | Mar 1893 |
| Most Recent Observation: | Oct 2013 |
- ROSWELL
- ROSWELL FAA AP
- ROSWELL IND AIR CTR
- ROSWELL IND AIR PK
- ROSWELL IND AP
- ROSWELL INDUSTRIAL AIR CENTER
- ROSWELL INDUSTRIAL AIR PARK
- ROSWELL MUNI AP
- ROSWELL WSO AP
- ROSWELL/INDUS
- ROSWELL/INDUSTRIAL
- ROSWELL/INDUSTRIAL AIR P
- WALKER AAF
- WALKER AFB
| Dataset Updated: | 15-Nov-2013 16:20:30 |
| Temperature Sites: | 40,747 |
| Monthly Mean Observations: | 15,717,007 |
| Most Recent Month: | October 2013 |
| Earliest Month: | January 1701 |